Create a chart that answers one question, with labels and units that readers can interpret. This tutorial focuses on a repeatable real-world task you can test on a sample file, not an unverified performance claim. LibreOffice is a desktop office suite; application menus and options may differ by operating system and release.
How to do it: a practical workflow
Work on a copy of your files when learning a new application. The sequence below gives you a testable outcome and a way to verify the result.
- Step 1. Structure data with a simple category or date column and a numeric value column.
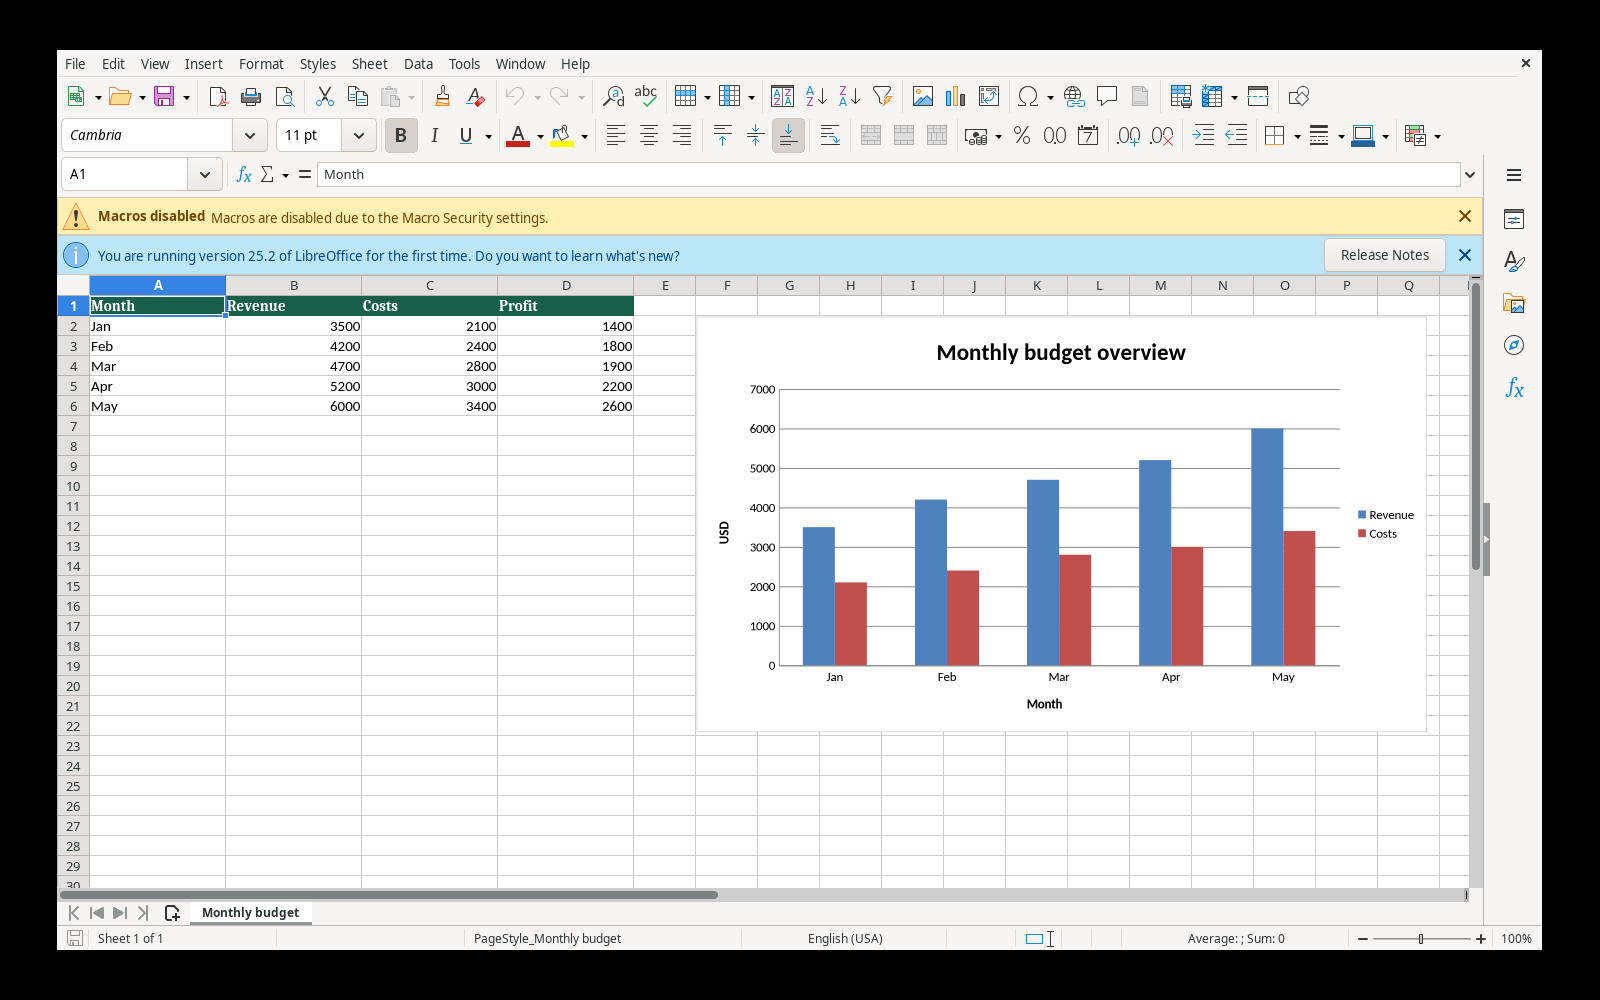
- Step 2. Select the actual table, including useful headers, and open the chart insertion wizard.
- Step 3. Choose chart type based on the question: columns for category comparison or lines for trends over time.
- Step 4. Add a meaningful title, axes and units. Remove visual clutter that does not help interpretation.
- Step 5. Change an underlying value and ensure the chart reflects the revised data before sharing.
Worked example you can recreate
For monthly expenses Jan–Jun, a line chart shows trend changes while a column chart compares month totals. A chart labelled “Spend (USD)” communicates far more than one called simply “Data”.
Common problems and what to verify
Charts can hide issues when the numeric series contains blanks or text. Always inspect the source range and baseline.
Before handing a document to someone else, open the output in the format that person will use. Check the content and key calculations rather than relying on an export-success notification.
Quick answer
Can I copy a Calc chart into Impress?
Yes, but inspect the chart and underlying data after transfer or export, especially if edits are expected.
Official reference and download
These instructions draw on documentation from The Document Foundation. For current user-interface details, refer to the official guide for this topic ↗. Download installation files only from LibreOffice's official download page ↗.
Keep learning
Each of these related guides answers a different task, so you can move from basic setup to a more specific workflow without repeating the same overview.
Independent educational coverage. Trebuchet is not affiliated with or endorsed by The Document Foundation. This article describes documented workflows and illustrative examples; it is not a report of hands-on benchmarking or testing.